Understanding my survey results by Bar Graph analysis
STEP 1
Watch the video entry about survey data analysis creating a bar graph. While the video playing there will be some inquiry questions to answer.
https://edpuzzle.com/media/6067c8883914d54287f869cc
Watch the video entry about survey data analysis creating a bar graph. While the video playing there will be some inquiry questions to answer.
https://edpuzzle.com/media/6067c8883914d54287f869cc
STEP 3
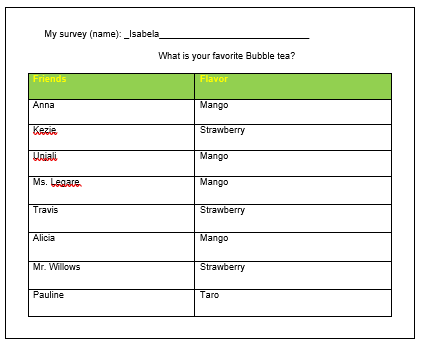
Create a Bar Graph using data you have collected from your friends’ favorite food. Use the online Bar Graph creator. For this use the link below:
https://nces.ed.gov/nceskids/graphing/classic/index.asp
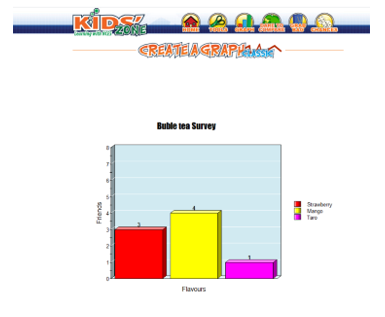
See the example of a Bar Graph created with this online tool below:
Create a Bar Graph using data you have collected from your friends’ favorite food. Use the online Bar Graph creator. For this use the link below:
https://nces.ed.gov/nceskids/graphing/classic/index.asp
See the example of a Bar Graph created with this online tool below:
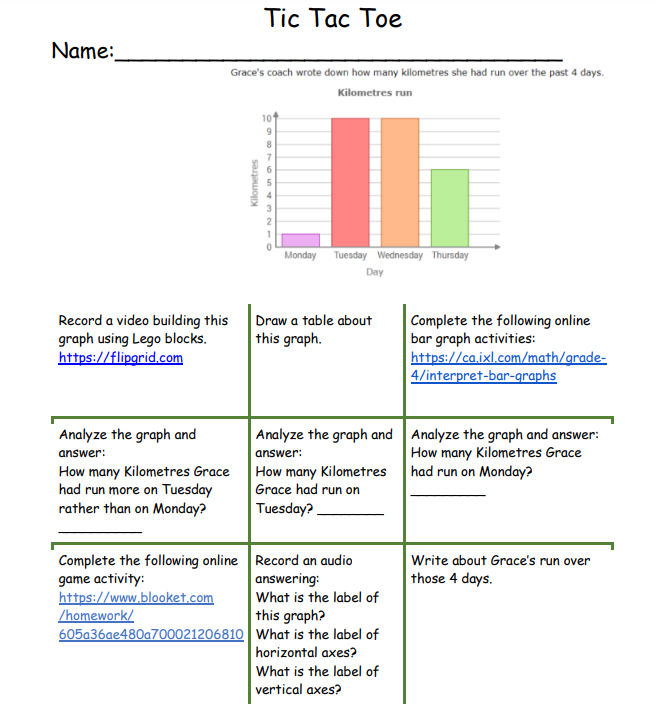
Links in the TIC TAC TOE Activity:
https://ca.ixl.com/math/grade-4/interpret-bar-graphs
https://youtu.be/oYXmY5axC2I
https://nces.ed.gov/nceskids/graphing/classic/index.asp
https://ca.ixl.com/math/grade-4/interpret-bar-graphs
https://youtu.be/oYXmY5axC2I
https://nces.ed.gov/nceskids/graphing/classic/index.asp