…Ensure all students have access to the technology and connectivity necessary to participate in authentic and engaging learning opportunities.
WHAT: UDL Lesson plan
The UDL Framework

The Universal Design for Learning framework (UDL), created by CAST, is a core guideline to help make learning inclusive and transformative for everyone. https://udlguidelines.cast.org/
This UDL lesson plan is designed by the guidelines of WHY, WHAT and HOW. This framework helps curriculum developers to build effective lesson plans, either for adult or k-12 learners. It starts by the purpose, the goal to achieve, capturing learners’ interest in the subject and presenting information differentiating learning. The instructor facilitates the learning process guiding learners and providing them opportunities to learn. This framework is in accordance with the BC Ministry of Education Framework, which encourages instructors to design critical-thinking activities and give students the confidence to create new ideas in their understanding.
In this UDL lesson plan, designed to grade 3-5 students, introducing data analysis, is clear to identify the Framework. The topic is presented with significance to their interests, provide engaged and inquiry introduction, differentiate learning with multiple strategies and using technology in tools. The students have opportunity to extend their learning and choose their better way of to apply their understanding by the formative and summative assessments.
WHY
Creating authentic and engaging learning opportunities is important because as educators, we need to address the needs of our diverse learners. Therefore, we need to adapt our activities and approaches to ensure that students are engaged and motivated. This lesson plan using the Universal Design for Learning (UDL) (Cast, n.d.), framework, aligns with Standard 1b for Educators of ISTE, which presents access to the technology and connectivity to students participate in authentic and engaging learning opportunities.
HOW
In this lesson plan learners are motivated to data analysis (the goal) by beginning with enquiry and thinking about how to understand data results. They engage in a survey of their interest and the teacher guides them in analyse their data in steps and providing different activities. In respect of learning for everyone, the range of activities provided are interdisciplinary and give options to using online tools or paper-based. The TIC TAC TOE homework gives them choices in their assessment. The students analyze their survey first creating a table, then a bar graph. It can be done in an online maker or on traditional paper. As extended activities, the learners can watch the strategy video designed by myself to apply their data in a pie chart.
Lesson Description:
In this multidisciplinary lesson, students will be doing a survey with their friends about their favourite food/ flavours, then apply the results in a table and bar graph. Also, students will learn how to analyze data and organize them to make conclusions. All the activities were designed to differentiate learning, giving students the opportunity to apply their understanding, such as using games, maps, coding, writing, arts, predictions and conclusions.
Highlights in the UDL lesson plan:
Webquest

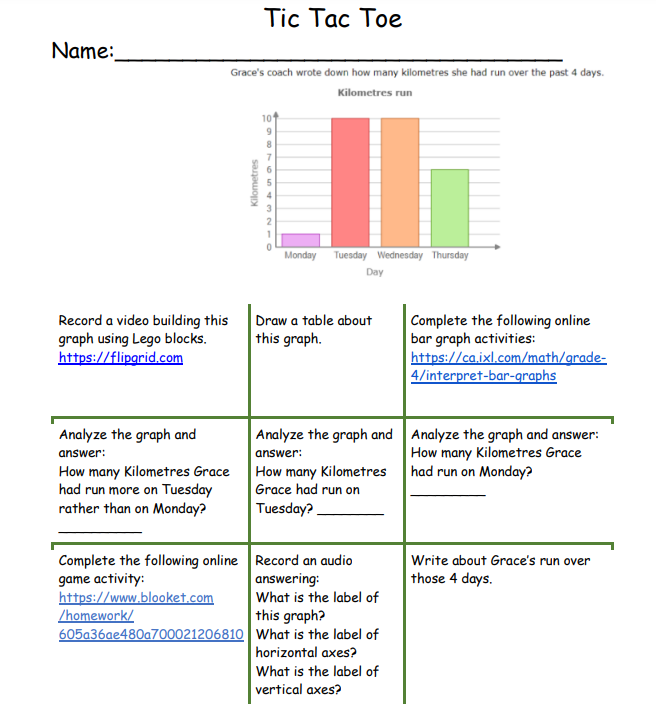
Understanding my survey results by Bar Graph analysis
Data Analyzis Instructional Strategy videos
This is an example of an Instructional Strategy to teach grade 3 to 5 students how to analyze their survey data collected using: Table, Bar Graph and Pie Chart. How interesting it is to transfer one to another simply!